
Your Department Dashboard
See all the metrics that matter to you at a glance using our delivery metrics dashboard.
Industry Standard Delivery
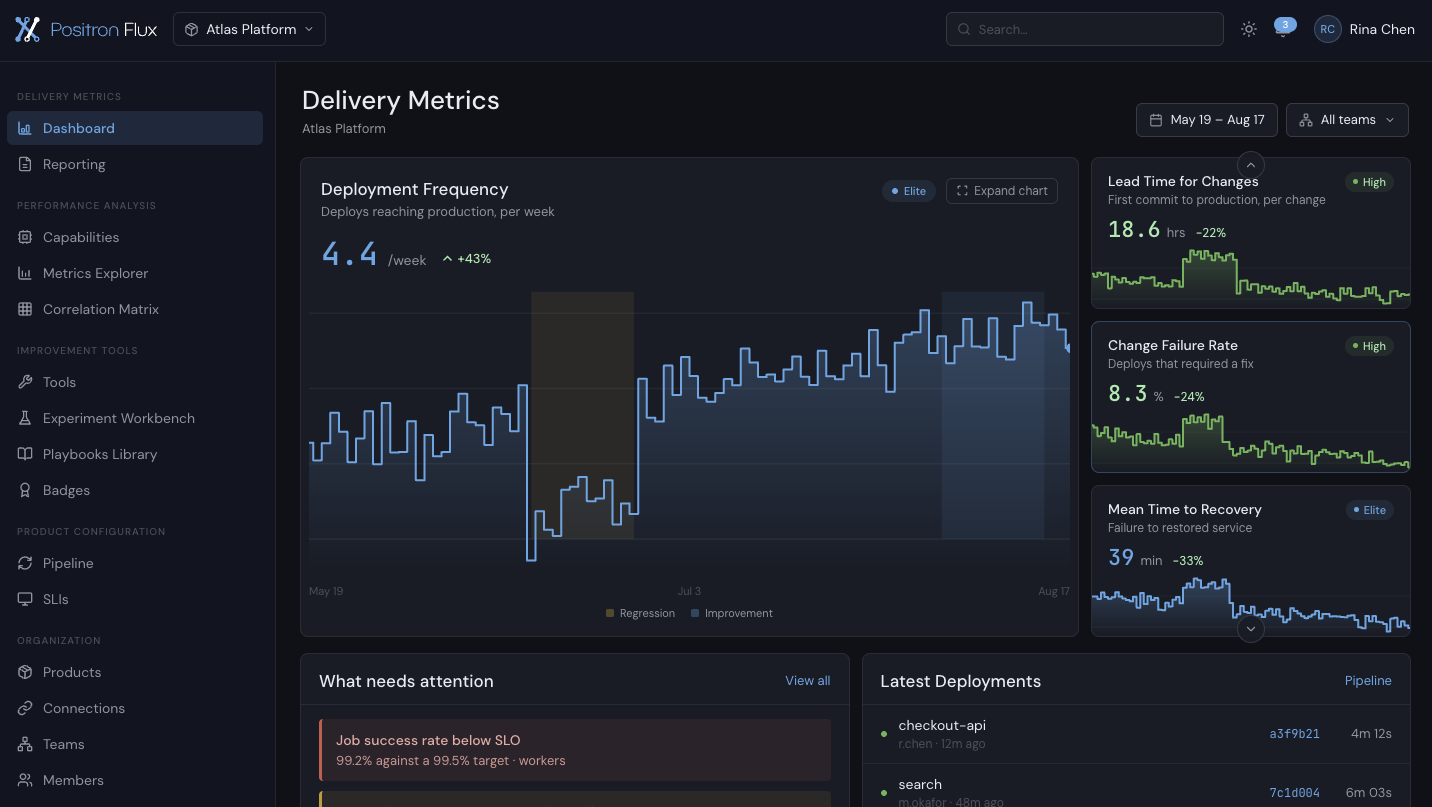
DORA is the industry standard for measuring software delivery: deployment frequency, lead time for changes, change failure rate and mean time to recovery. They are antagonistic metrics. They are useful for benchmarking with companies of similar size and industry, and they are typically numbers to optimize. Positron Flux measures them for you and uses them as optimization targets.
The Metrics That Make You Unique
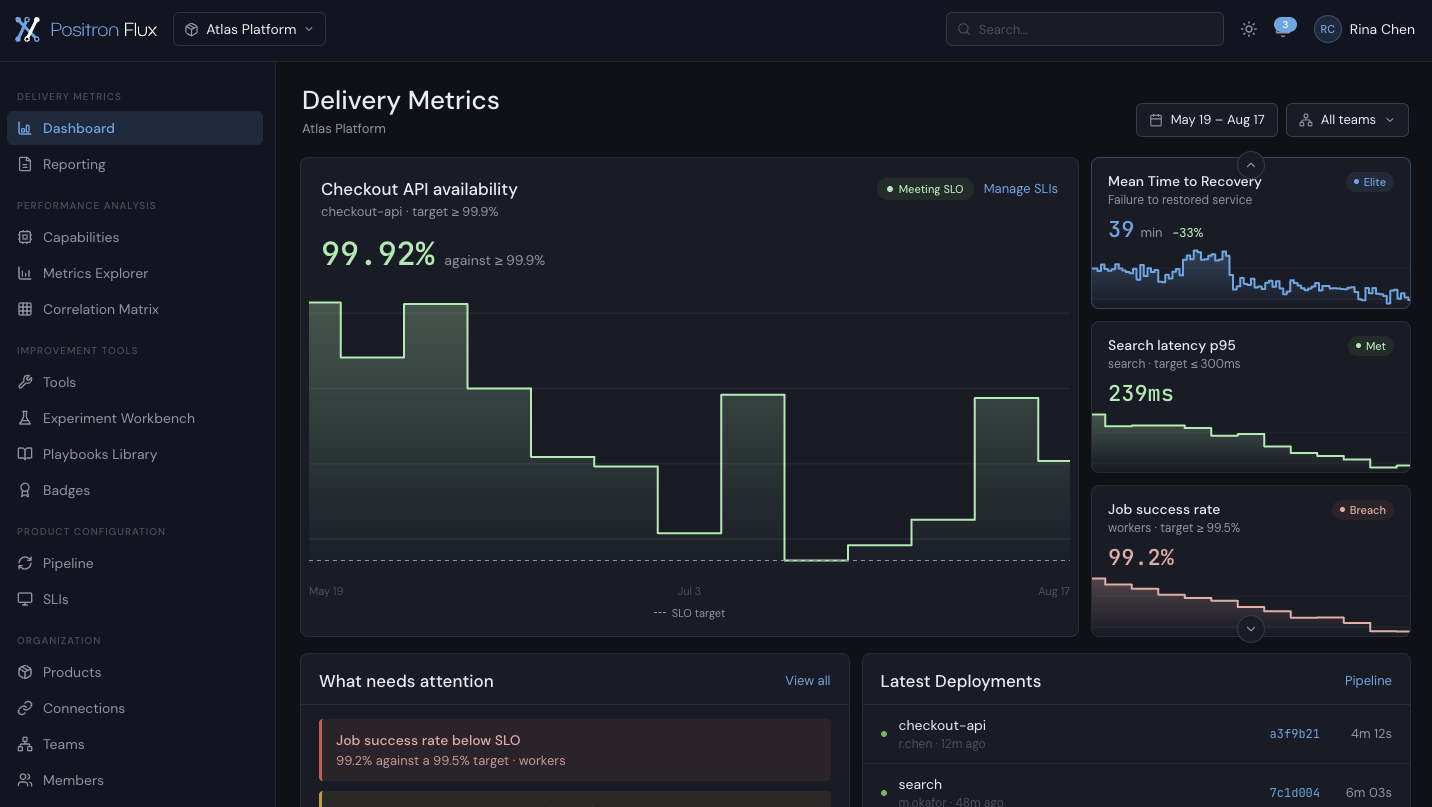
Every company is different, what is important to yours: uptime, or average time-to-first-byte, or something entirely different? If you measure it you can connect in into Positron Flux, and optimize for it.
What's happening in real time
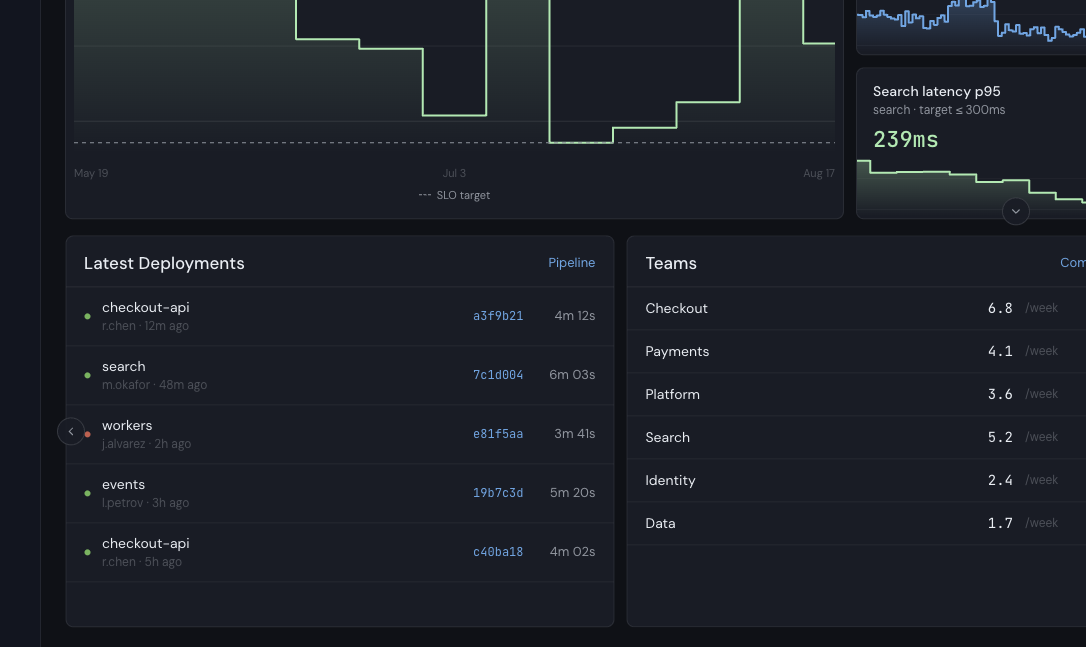
If your company has many teams and many projects, it’s hard to know what happening during the day. Our dashboard shows all the deployments happening, divided by product, and their timings and result. This puts you on top of things, and you can intervene if you need.
Ready to improve your delivery?
Join the Early Access Program and work directly with the founders until launch