Measure your delivery Understand what drives it Improve it systematically
Positron Flux is the delivery excellence workbench: it's a complete system for identifying, analyzing, and solving software development team performance issues, and for safely implementing agentic development.
Built by the people who built Stack Overflow and Toptal
Reads directly from the tools your team already ships with


Dashboards show you what happened. They don't tell you why, or what to do next.
Most engineering teams today have normalized a state that's costing them money, momentum, and developer retention.
No real visibility
Teams operate on gut feelings and anecdotes from retros. When leadership asks "how are we doing?" the answer is a shrug or a hedged story.
Numbers without explanation
Metrics show outcomes but not causes. Lead time spiked, but why? You end up hunting through Git logs and Jira tickets, burning hours on guesswork.
Knowing doesn't fix anything
Identifying a problem is step one. Most teams get stuck there. They sit through the same retro conversations quarter after quarter, and nothing changes.
From awareness to action, in three steps
Flux mirrors the journey every engineering leader needs: measuring what's happening, understanding why, and doing something about it.
Track
See your four software delivery metrics and custom SLIs/SLOs in one place. Benchmark against industry standards. Know where you stand, not where you hope you stand.
- Lead Time, Deploy Frequency, Change Failure Rate, MTTR
- Industry benchmark bands (Elite / High / Medium / Low)
- Shareable reports for board decks and quarterly reviews
Analyze
Understand what's driving your numbers. A correlation engine surfaces what changed when a metric moved, so you get explanations instead of guesswork.
- 40+ secondary metrics mapped to delivery capabilities
- Automatic correlation when metrics change
- Navigate by outcome or by practice
Improve
Move from diagnosis to action. Platform tools nudge better practices. Experiments measure what works. Playbooks guide you through proven improvements.
- Slack bots, GitHub bots, and CI/CD integrations
- Structured experiments with shareable reports
- Playbook library grounded in software delivery research
What could faster delivery save you?
Use our calculator to estimate the ROI of improving your software delivery metrics.
Built for engineering leaders who want evidence, not opinions
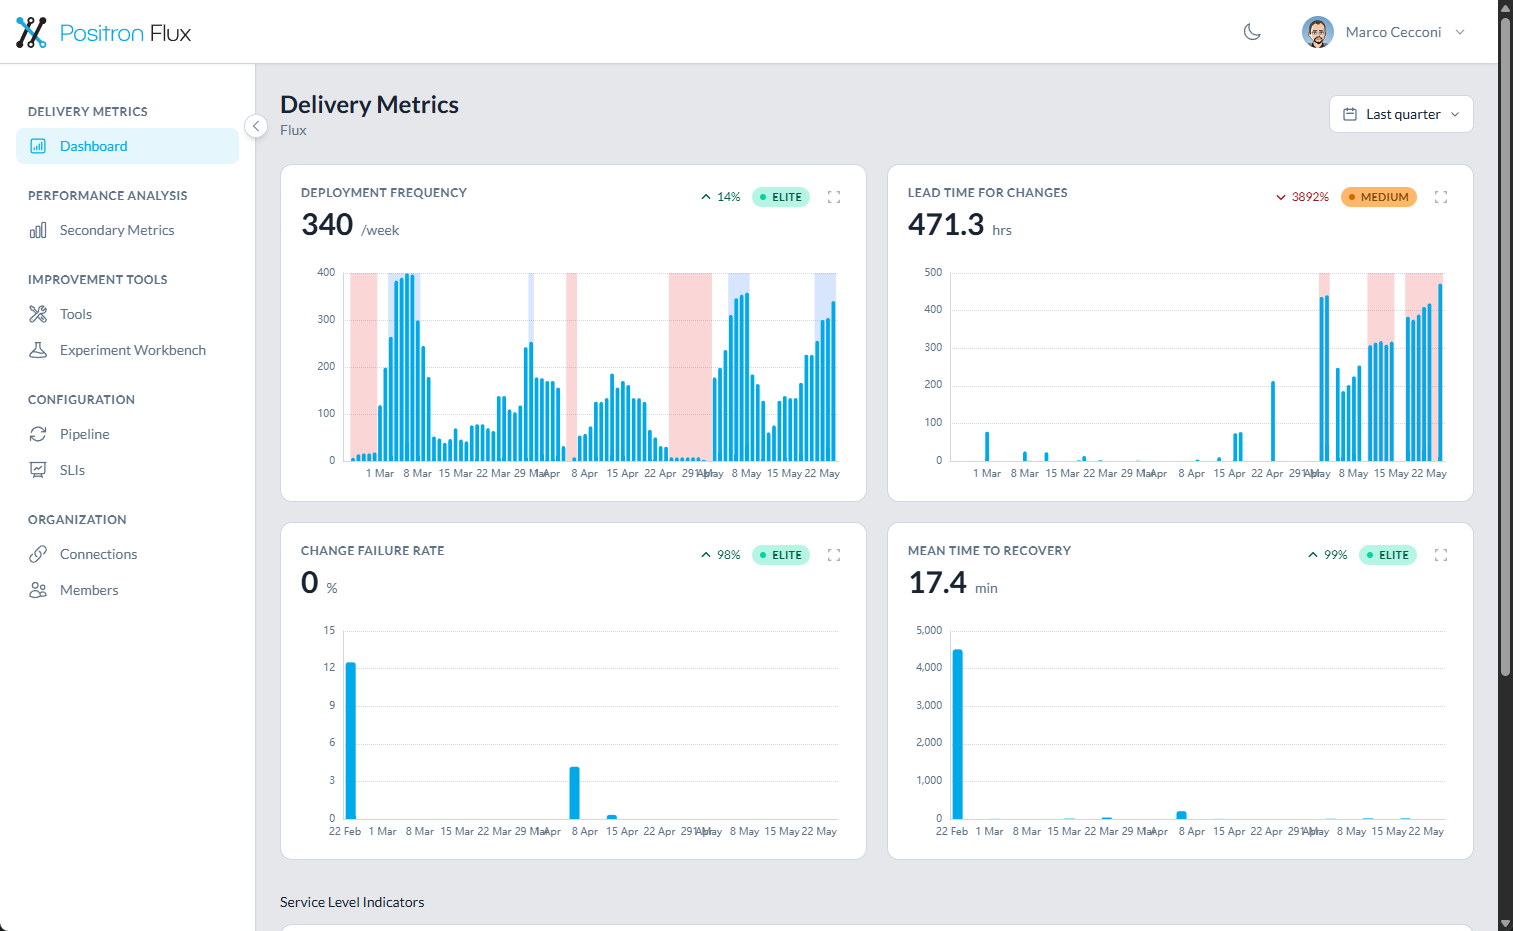
Your delivery health at a glance
The Delivery Metrics Dashboard shows your four software delivery metrics as time series with industry benchmark bands. Filter by team, product, and time range. Understand your delivery maturity in 30 seconds.
Generate shareable reports for board decks and quarterly reviews. Set up once, receive automatically on your schedule.
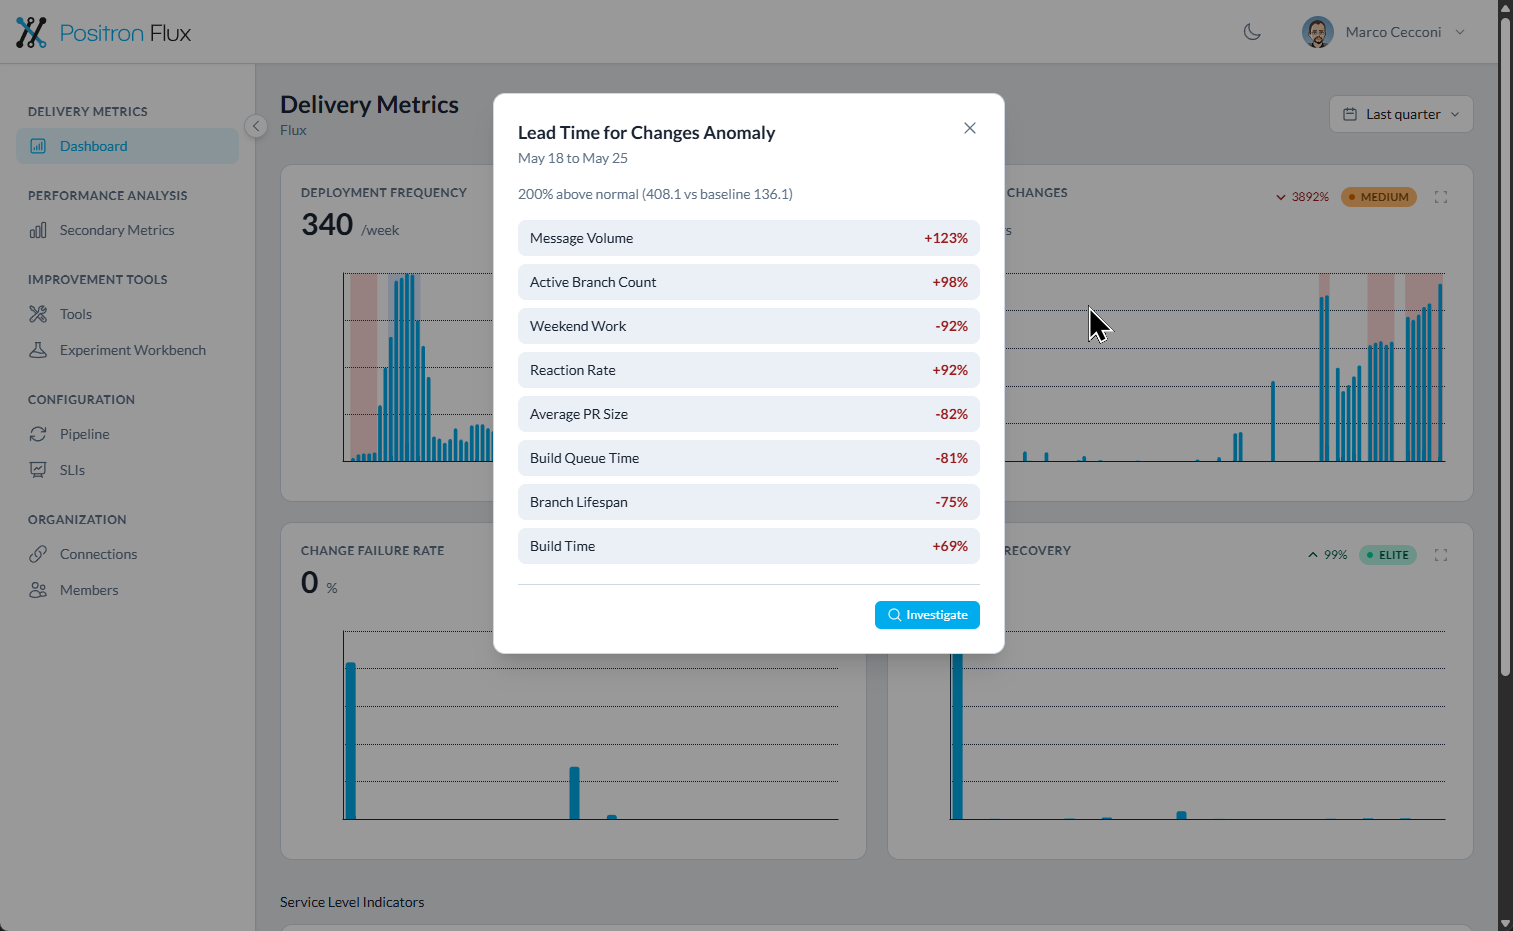
Stop guessing. Start understanding.
When lead time spikes, the correlation engine automatically surfaces what changed: larger PRs, slower reviews, fewer reviewers available. You get evidence, not speculation.
Over 40 secondary metrics organized by which delivery outcome they influence and which capability they indicate. Navigate by problem or by practice.
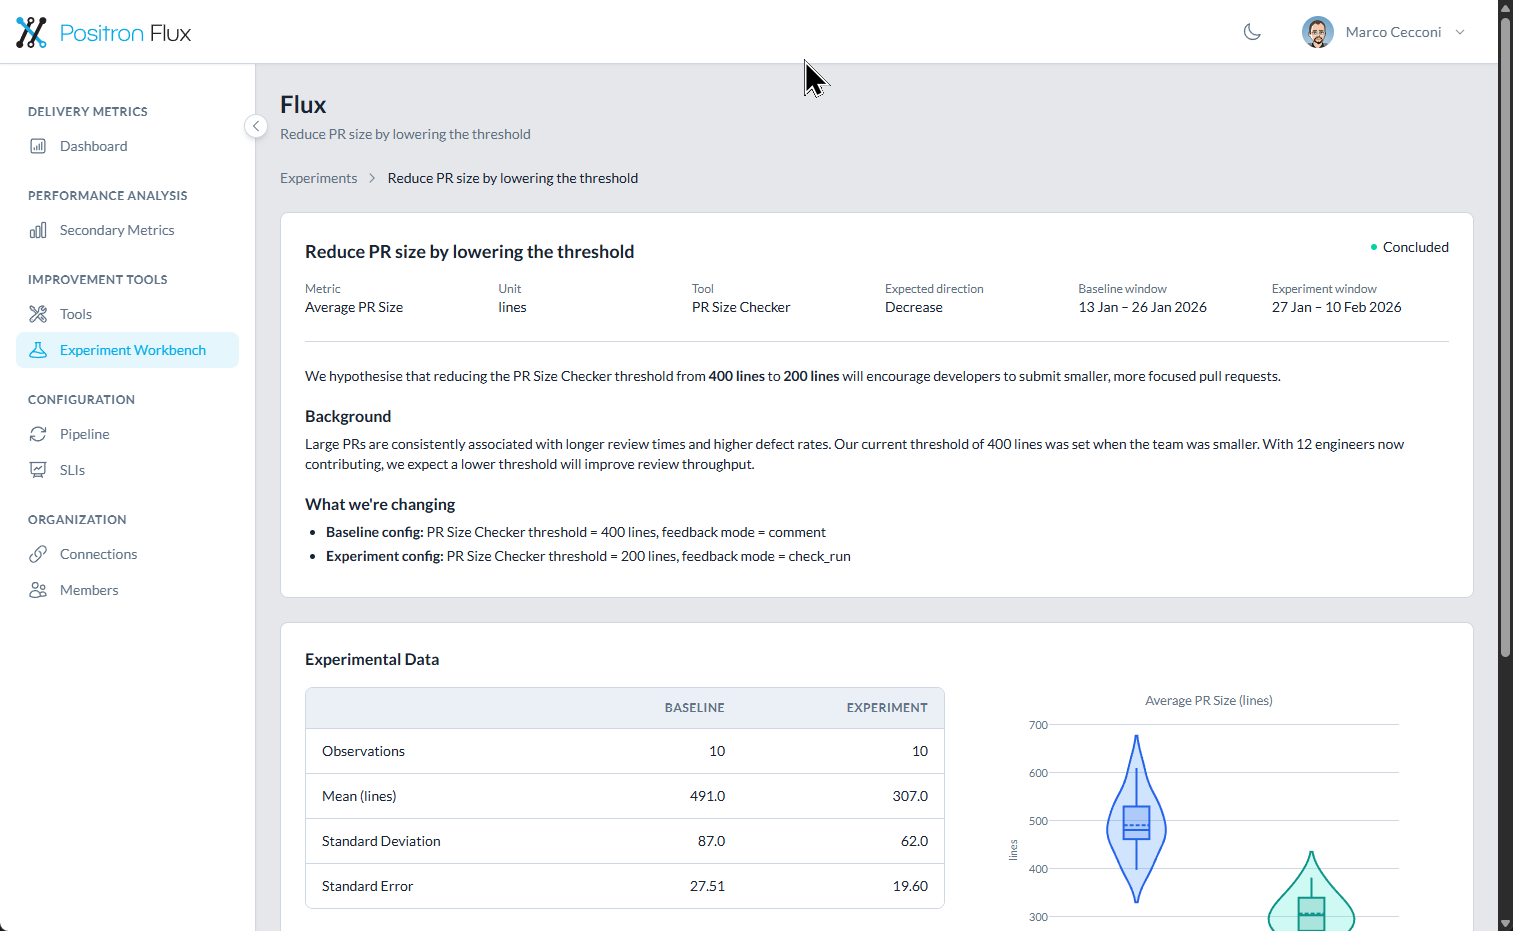
From diagnosis to proven results
Platform tools plug into Slack, GitHub, and Jira to nudge better practices where your team already works. PR size checkers, review reminders, deployment leaderboards, and more.
Run structured experiments to prove what works. Share results with your CTO as evidence, not opinion. Follow playbooks grounded in software delivery research to build lasting improvement.
Ready to improve your delivery?
Join the waitlist to be among the first to use Positron Flux
Join Early AccessConnects to the tools your team already uses
Pull data from your source control, CI/CD, issue tracking, incident management, and monitoring tools. Setup takes minutes, not hours.
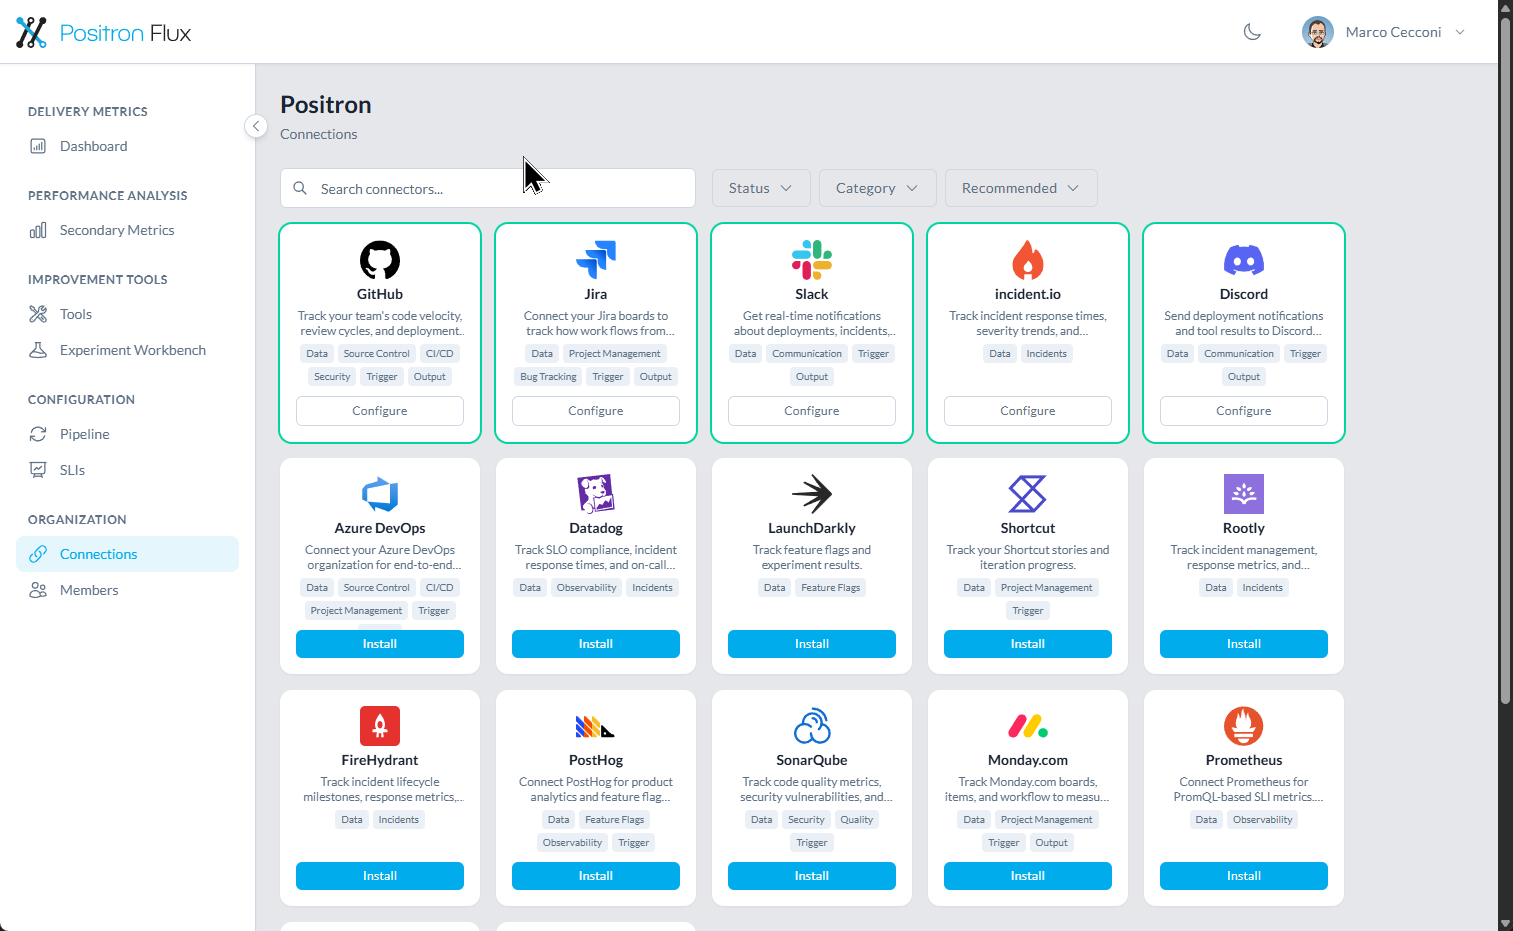
And many more. If you use it, we probably integrate with it.
Built for people who ship software
Different roles, different needs. Flux serves them all.
CTOs & VPs of Engineering
Get visibility into delivery maturity across your organization. Benchmark against industry standards. Generate board-ready reports that show real progress, not hand-wavy estimates.
Evidence you can use to manage upward.
Senior Devs & Tech Leads
You know something is off. You've read the research on doing better. Flux gives you free tools to try with your team and structured experiments to prove what actually works.
Build a business case your CTO can't ignore.
Engineering Managers
Drive day-to-day delivery improvement with proven playbooks. Dashboards track your team's progress. Reports demonstrate the concrete impact your initiatives are having.
Show the value of the work you're doing.
Get early access to Positron Flux
We're opening access in Q2 2026. Join the Early Access Program to be among the first to try the platform.
No credit card required. We'll never share your information.